Mayavi — Plotting complicated surfaces with mesh()
Using Mayavi's surf() function to plot a surface in 3D is rather simple, but to understand the idea of the mesh() function is a bit more tricky.
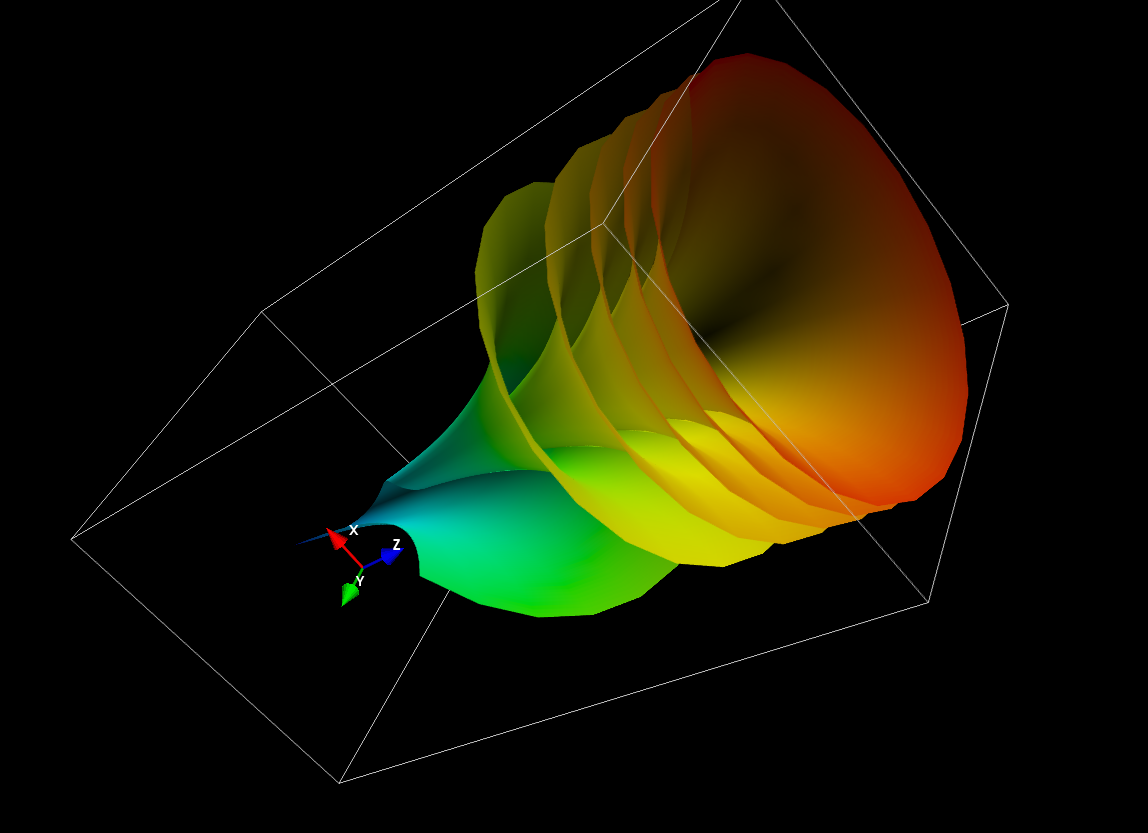
What we want to do now is plot a surface with an azimuthal gradient such that we get something between a screw and trumpet:
The Approach
Using some suitable boundaries for our domain the logarithm shows some beautiful trumpet shape in the range ] 0, 1.5 ] in a polar coordinate system. Now that we have some trumpet shape we want to introduce the "screwing" element by some azimuthal dependency. So we use the function
ƒ(r, φ) = ln(r * φ).
By choosing the domain of definition as [ 0.5 pi, 12 pi ] for φ we can make multiple roundabouts. For some further convenience we limit the domain for r as well
import numpy
from mayavi import mlab
r,phi = numpy.mgrid[1e-1:1.5:128j,.5*numpy.pi:12*numpy.pi:128j]
As the above domain for φ is not reasonable in any sense of a polar, cylindrical or spherical coordinate system abd because Mayavi expects cartesian coordinates we have to perform a coordinate transformation
x = lambda r,phi: r*numpy.cos(phi)
y = lambda r,phi: r*numpy.sin(phi)
z = numpy.log(phi*r)
Having the function's values in cartesian coordinates we can plot the function against the transformed coordinate system
mlab.mesh(x(r,phi),y(r,phi),z)
mlab.outline()
mlab.show()
Conclusion
In order to plot a complicated structure like our spiraling trumpet we need to start with a domain suitable to provide the required coordinate values.
Having the function on this domain the coordinate system needs to be transformed into a cartesian system. And finally the surface can be plotted in this coordinate system. Et voila!
