Masking NumPy Arrays
Introduction
In some cases one wants to get rid of some values in an array, e.g. for
- displaying radial symmetric data
- fitting the background of an image to a function
- fitting a function only to an interesting part of an array.
The options to achieve this can be as simple as setting unwanted values to a numeric constant (in some cases) or to the special constant NaN (not a number). This is really simple, but not elegant and may be not helpful if the array elements that need to be masked are arranged in an irregular pattern. For the latter case NumPy offers already a masked array data type!
NumPy's Masked Arrays
 Masked arrays are created as easy as in the alternative scenarios except that we do not mess around with the elements of the array, but define a second array of identical shape that tells the masked array which elemts are masked (boolean True or simply 1) and which are not (boolean False or simply 0).
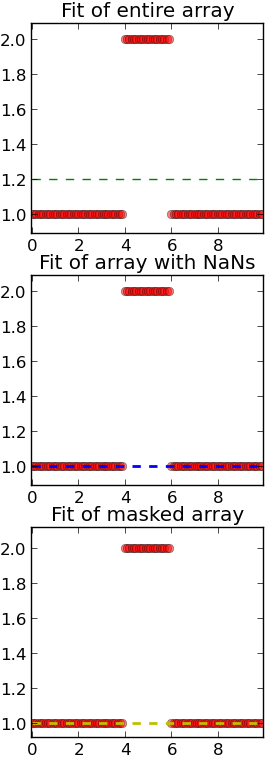
As a little simple example let's have a look at a 1D array containing data (step function) that shall be fitted with a linear function. As you can see the fit algorithm respectes the offset elements at the center and returns a fit line that is offset from the background elements.
On the other hands when masking the array with NaNs or using the masked array object the fit algorithm does not take into account the central elements and the fit function coincides with the background elements.
#!/usr/bin/env python

import Image
import numpy
import numpy.ma
import scipy.optimize
import pylab

x = numpy.arange(0,10,.1)
y = numpy.ones_like(x)
z = y.copy()
z[40:60] = numpy.nan
y[40:60] = 2
a = numpy.ma.masked_array(y.copy(),y-1)

fitf = lambda u,x: u[0]*x+u[1]
errf = lambda u,x,y: y - fitf(u,x)

u = numpy.array([0,1])
p = scipy.optimize.leastsq(errf,u,args=(x,y))
q = scipy.optimize.leastsq(errf,u,args=(x,z))
r = scipy.optimize.leastsq(errf,u,args=(x,a))
print p,q,r

pylab.figure(figsize=(3,6))
pylab.subplot(311)
pylab.title("Fit of entire array")
pylab.plot(x,y,'ro',alpha=.5)
pylab.plot(x,fitf(p[0],x),'g--')

pylab.subplot(312)
pylab.title("Fit of array with NaNs")
pylab.plot(x,y,'ro',alpha=.5)
pylab.plot(x,fitf(q[0],x),'b--',lw=2)

pylab.subplot(313)
pylab.title("Fit of masked array")
pylab.plot(x,y,'ro',alpha=.5)
pylab.plot(x,fitf(r[0],x),'y--',lw=2)

pylab.show()
Masking a NumPy Array with an Image
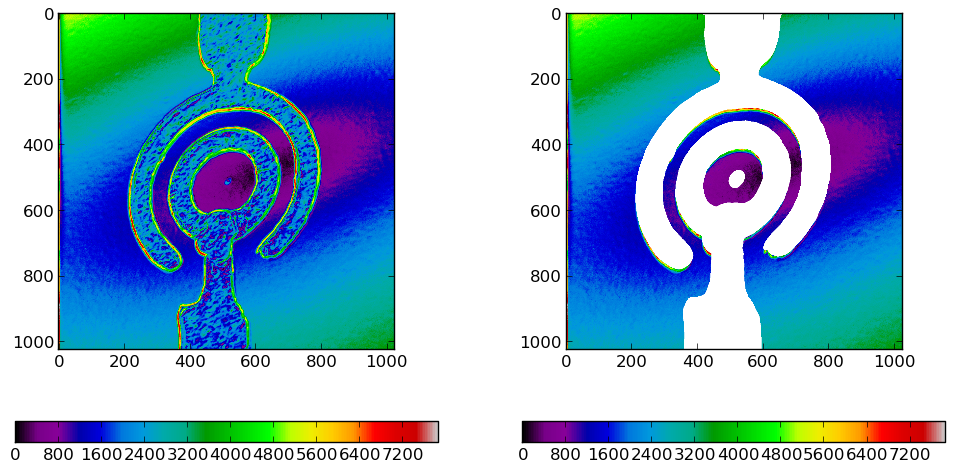
This was a rather trivial example, but if one has more than one dimension it can get very tricky to mask all unwanted elements. Even if the following is not as trivial as the previous example, masking a complex structure is still very simple:
- Export the data as a greyscale image. A greyscale image at this point is only important for confenience as there is no need for more color channels than neccessary. Of course you could export an RGB image and transform it into a grayscale image with Gimp.
- Manipulate the image with Gimp or a comparable program. In Gimp we edit the image as we like until it only contains two colors: black (zero) and white (one). At this point you should make sure to save an 8bit grayscale image because a grayscale image is easier to process later.
- Load the image into Python and put its data into an array. Thanks to the PIL (Python Imaging Library) loading the Image data and handing it to an array is very simple. We only have to reshape the data as the Image's getdata() method returnes a flattened data set. If the image would not be grayscale but RGB, we would hava a data set three times as long.
#!/usr/bin/env python

import Image
import numpy
import numpy.ma
import scipy.optimize
import pylab
import matplotlib.cm

y = numpy.load("data.npy")
data = numpy.sqrt( (y[0,:,:]-y[2,:,:])**2 + (y[1,:,:]-y[3,:,:])**2 )
data2 = data / data.max() * 255

im = Image.fromarray(data2.astype("uint8"),"L")
im.save("mask_2D_preedit.png")

# Now you should have edited the image with GIMP and
# saved your mask as 'mask_2D_postedit.png'.

maskim = Image.open("mask_2D_postedit.png")
mask = numpy.array(maskim.getdata()).reshape((1024,1024))
data2 = numpy.ma.masked_array(data,mask)

# Now you got a masked array without any disturbing
# elements for further treatment.

pylab.figure(figsize=(12,6))
pylab.subplot(121)
pylab.imshow(data,cmap=matplotlib.cm.spectral)
pylab.colorbar(orientation="horizontal")

pylab.subplot(122)
pylab.imshow(data2,cmap=matplotlib.cm.spectral)
pylab.colorbar(orientation="horizontal")

pylab.show()


